

One of the least glamorous problems on an industrial site is also one of the most persistent. People look for things.
Tools. Carts. Containers. Materials. Vehicles. Work-in-progress. Equipment that somebody saw twenty minutes ago and cannot find now.
Searching tends to disappear inside labor costs because it happens in small increments. There is rarely a line item called “time spent walking around trying to locate equipment.” But multiply five minutes of searching across people, shifts, assets, and working days, and a habit that looks trivial becomes a capacity problem.
A search problem is often a flow problem in disguise.
What real-time location technology changes about searching
Real-time location gives a physical asset a searchable location. A user can find its current position and, depending on the system, see where it has been, how long it stayed there, and whether it moved through expected areas.
The first benefit is obvious: less searching.
The second is more interesting. Once location history exists, the operation can ask why the asset was difficult to find in the first place.
Cardinal Health: 1,500+ mobile carts in a distribution operation
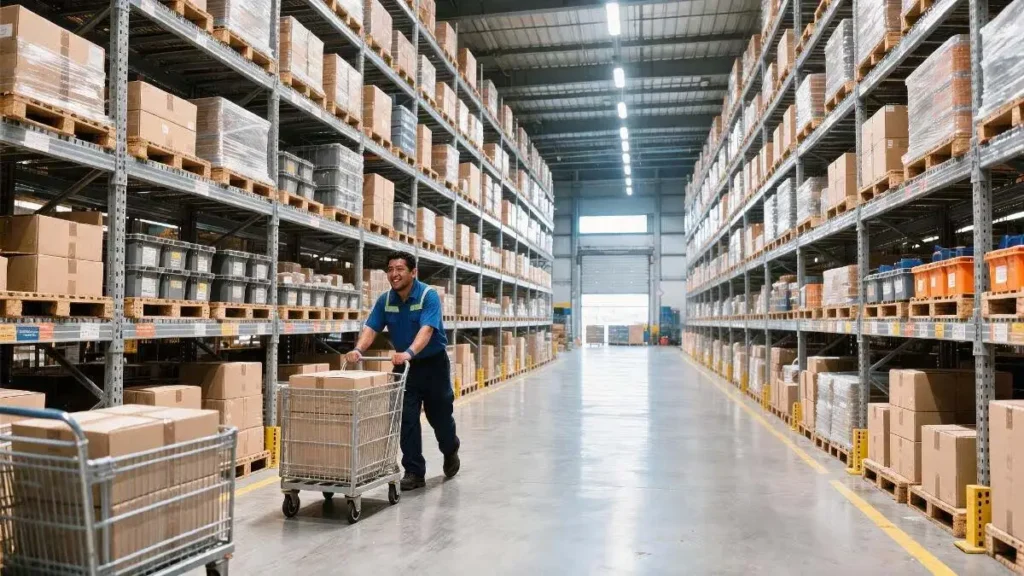
At a Cardinal Health warehouse in Juarez, Mexico, more than 1,500 mobile carts moved through multiple operational zones. Reliance on manual searches slowed retrieval and made workflow adherence and resource allocation harder to see.
The deployment used compact tags, 68 anchors, and 17 gateways, with location data updating every 30 seconds, supported by zone monitoring, alerts, device-status visibility, and reporting.
- 90% reduction in asset search time
- ~$300K in annual cost savings
- 1,500+ mobile carts tracked
The more important transition was not from “Where is Cart 127?” to a faster answer. It was from “Where is Cart 127?” to “Why are carts repeatedly spending too long in this part of the process?”
Do you need more equipment, or better visibility?
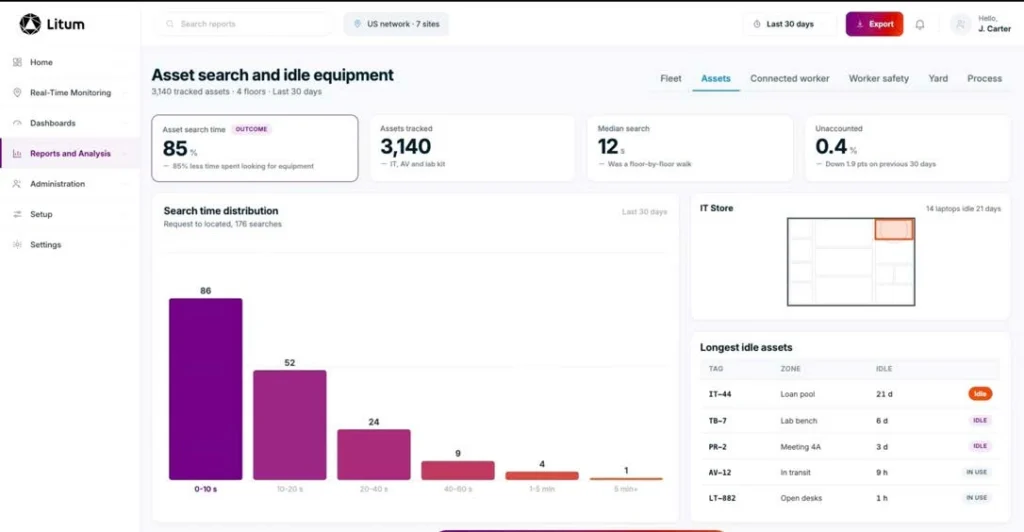
Industrial organizations frequently face a familiar request: more equipment.
The request may be justified. But without utilization data, it is difficult to distinguish a true capacity constraint from poor allocation.
Location history can show how much time an asset is actually active, how often it moves, where it sits idle, whether similar assets are being used unevenly, and whether equipment is available where demand occurs.
Instead of asking “How many assets do we own?” the question becomes: “How much productive capacity are those assets actually providing?”
Utilization becomes more useful when the location record can be connected to ERP, MES, WMS, or maintenance systems. The asset then has a digital state and a physical state that can be reconciled.
GE Aerospace venture TEI: 3,000 assets in aerospace manufacturing
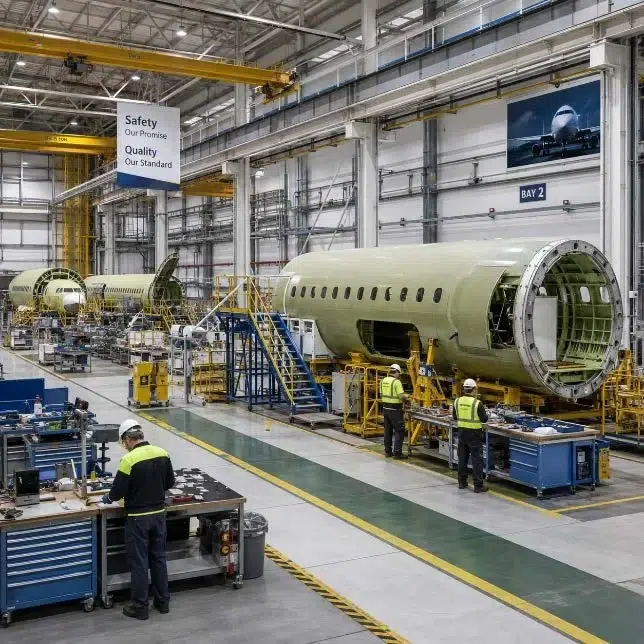
GE Aerospace venture TEI relied on manual processes to locate and manage approximately 3,000 assets across an aerospace production facility.
A UWB-based deployment introduced real-time location, movement history, heat maps, reporting, barcode matching, SAP integration, and mobile access. The SAP integration mattered almost as much as the location technology itself: it connected two versions of the asset, the physical object and the digital record.
- 70% reduction in manual search time
- 10% estimated utilization improvement
- 3,000 assets tracked
Movement is data
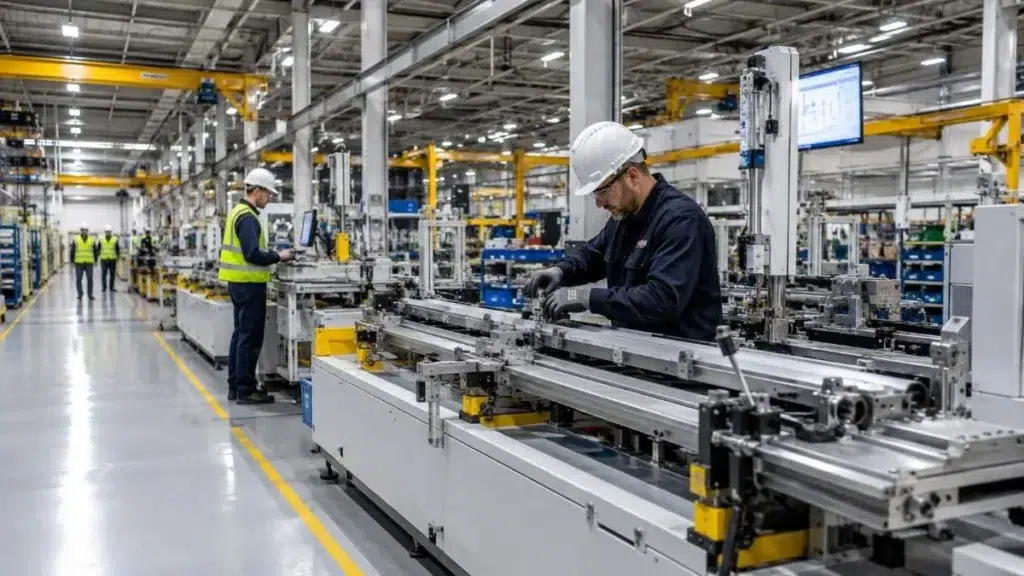
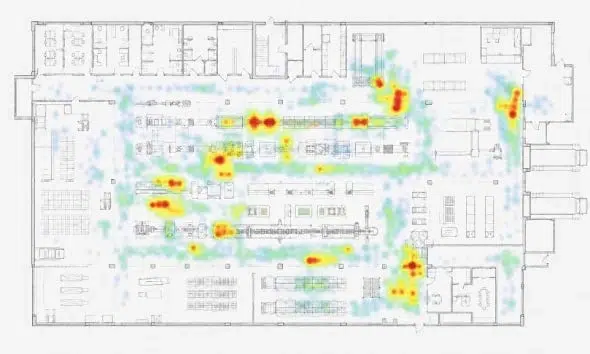
Every location update is one observation. Over days, weeks, and months, those observations form a picture of how physical work actually moves.
A facility may contain thousands of movements every hour. Workers move between zones. Forklifts travel between docks and staging areas. Work-in-progress advances through production. Containers wait. Assets circulate. Queues form and disappear. Without continuous location data, much of this activity is difficult to quantify.
The value of dwell time
Dwell time sounds almost trivial. Something entered a zone at 10:14 and left at 10:52. Thirty-eight minutes.
But if the expected time is ten minutes, there is a problem. If the same delay happens every afternoon, there may be a pattern. If it only affects one asset type, the cause may be different again.
A transaction system might tell you the total process took four hours. Location data can help show where those four hours went.
What location history can answer
| Question type | What it tells you |
|---|---|
| Dwell time | How long does an entity remain in a particular area? |
| Zone transitions | How does a person, vehicle, or asset progress between operational areas? |
| Heat maps | Where does activity concentrate? |
| Spaghetti diagrams | What paths are people, assets, or vehicles actually taking? |
| Utilization | How much time is equipment active versus idle? |
| Lead time | How long does movement from one defined stage to another actually take? |
| Alert history | Where and when do exceptions repeatedly occur? |
Building the business case
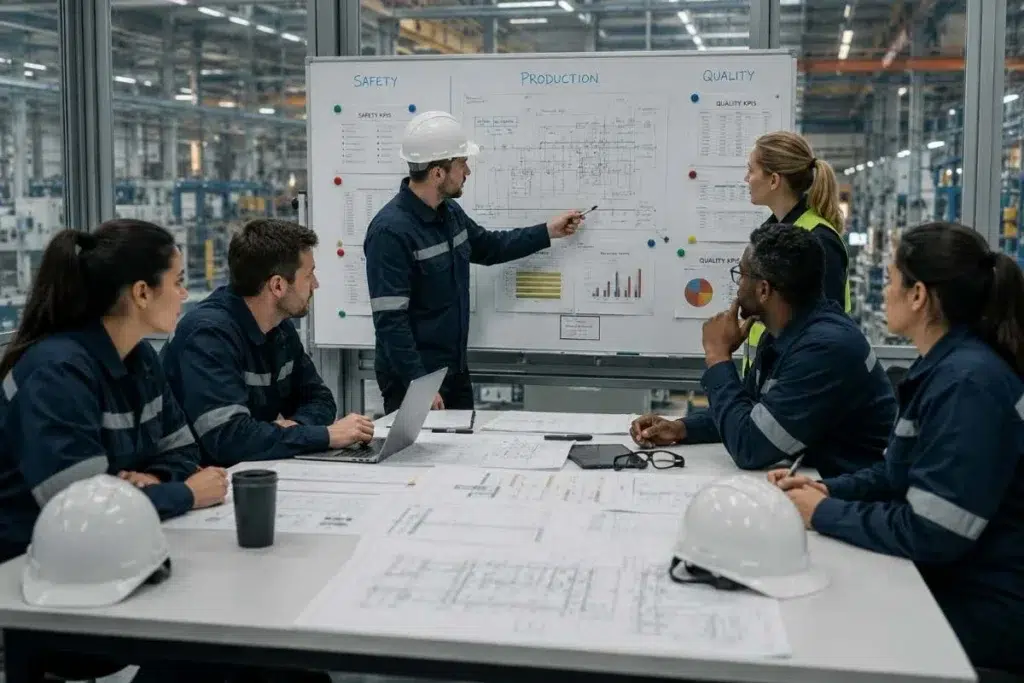
RTLS projects are easier to justify when they begin with a business problem and a measurable starting point, not with the technology itself.
Value in this category typically comes from a few sources: labor (search time, manual counting, unnecessary travel), asset and fleet utilization (idle equipment, avoidable purchases, poor allocation), process flow (dwell, waiting, bottlenecks, inefficient routing), and integration and administration (manual reconciliation between physical and digital records).
A simple framework: annual value created equals labor recovered, plus capacity released, plus operational delay avoided, plus administrative savings.
The prerequisite is a baseline. If the current cost of searching, waiting, or idle equipment is unknown, the value of improving it will also be difficult to prove. Before selecting a system, it helps to establish current search time per shift, current utilization rates, and current dwell time by stage.
What RTLS does not automatically fix is worth naming too. It is a source of data and operational context, not a substitute for good process design. On its own, it will not solve a fundamentally inefficient workflow, poor master data, unclear ownership, weak change management, inadequate safety procedures, an undefined business problem, or a project with no measurable KPI.
In fact, location data may expose problems that were previously hidden. That is often part of its value.
For organizations that want to go further into ROI calculation specifically, our detailed breakdown of asset tracking ROI walks through the full framework.
The search problem, restated
Searching for things is rarely treated as a real cost because it never shows up as one line on a balance sheet. It shows up as five minutes here, twenty minutes there, spread across every shift, every asset, every day.
Asset utilization data turns that invisible cost into a measurable one, and turns “we probably need more equipment” into a question that can actually be answered with evidence.
FAQ
What is asset utilization in an industrial setting? Asset utilization measures how much of an asset’s available time it spends in active use versus idle or unavailable. Real-time location data makes this measurable by tracking movement, active periods, and idle time continuously rather than through spot checks or manual logs.
How does RTLS reduce asset search time? RTLS assigns a real-time, searchable location to tools, carts, containers, and equipment. Instead of walking the floor or calling coworkers, a user can look up an asset’s current position and its recent movement history, which also reveals why the asset was hard to find in the first place.
What is dwell time and why does it matter? Dwell time is how long an asset, vehicle, or person remains in a defined area. Comparing actual dwell time against expected dwell time surfaces bottlenecks, recurring delays, and process steps that are quietly taking longer than assumed.
Does more equipment always solve a utilization problem? Not necessarily. Location history often shows that the real issue is allocation rather than capacity: assets sitting idle in the wrong place while others are in constant demand. Measuring utilization before purchasing additional equipment helps confirm whether more assets are actually needed.